
v. 2022.2.0
Risk Cloud Quantify: Embedded Analysis Data
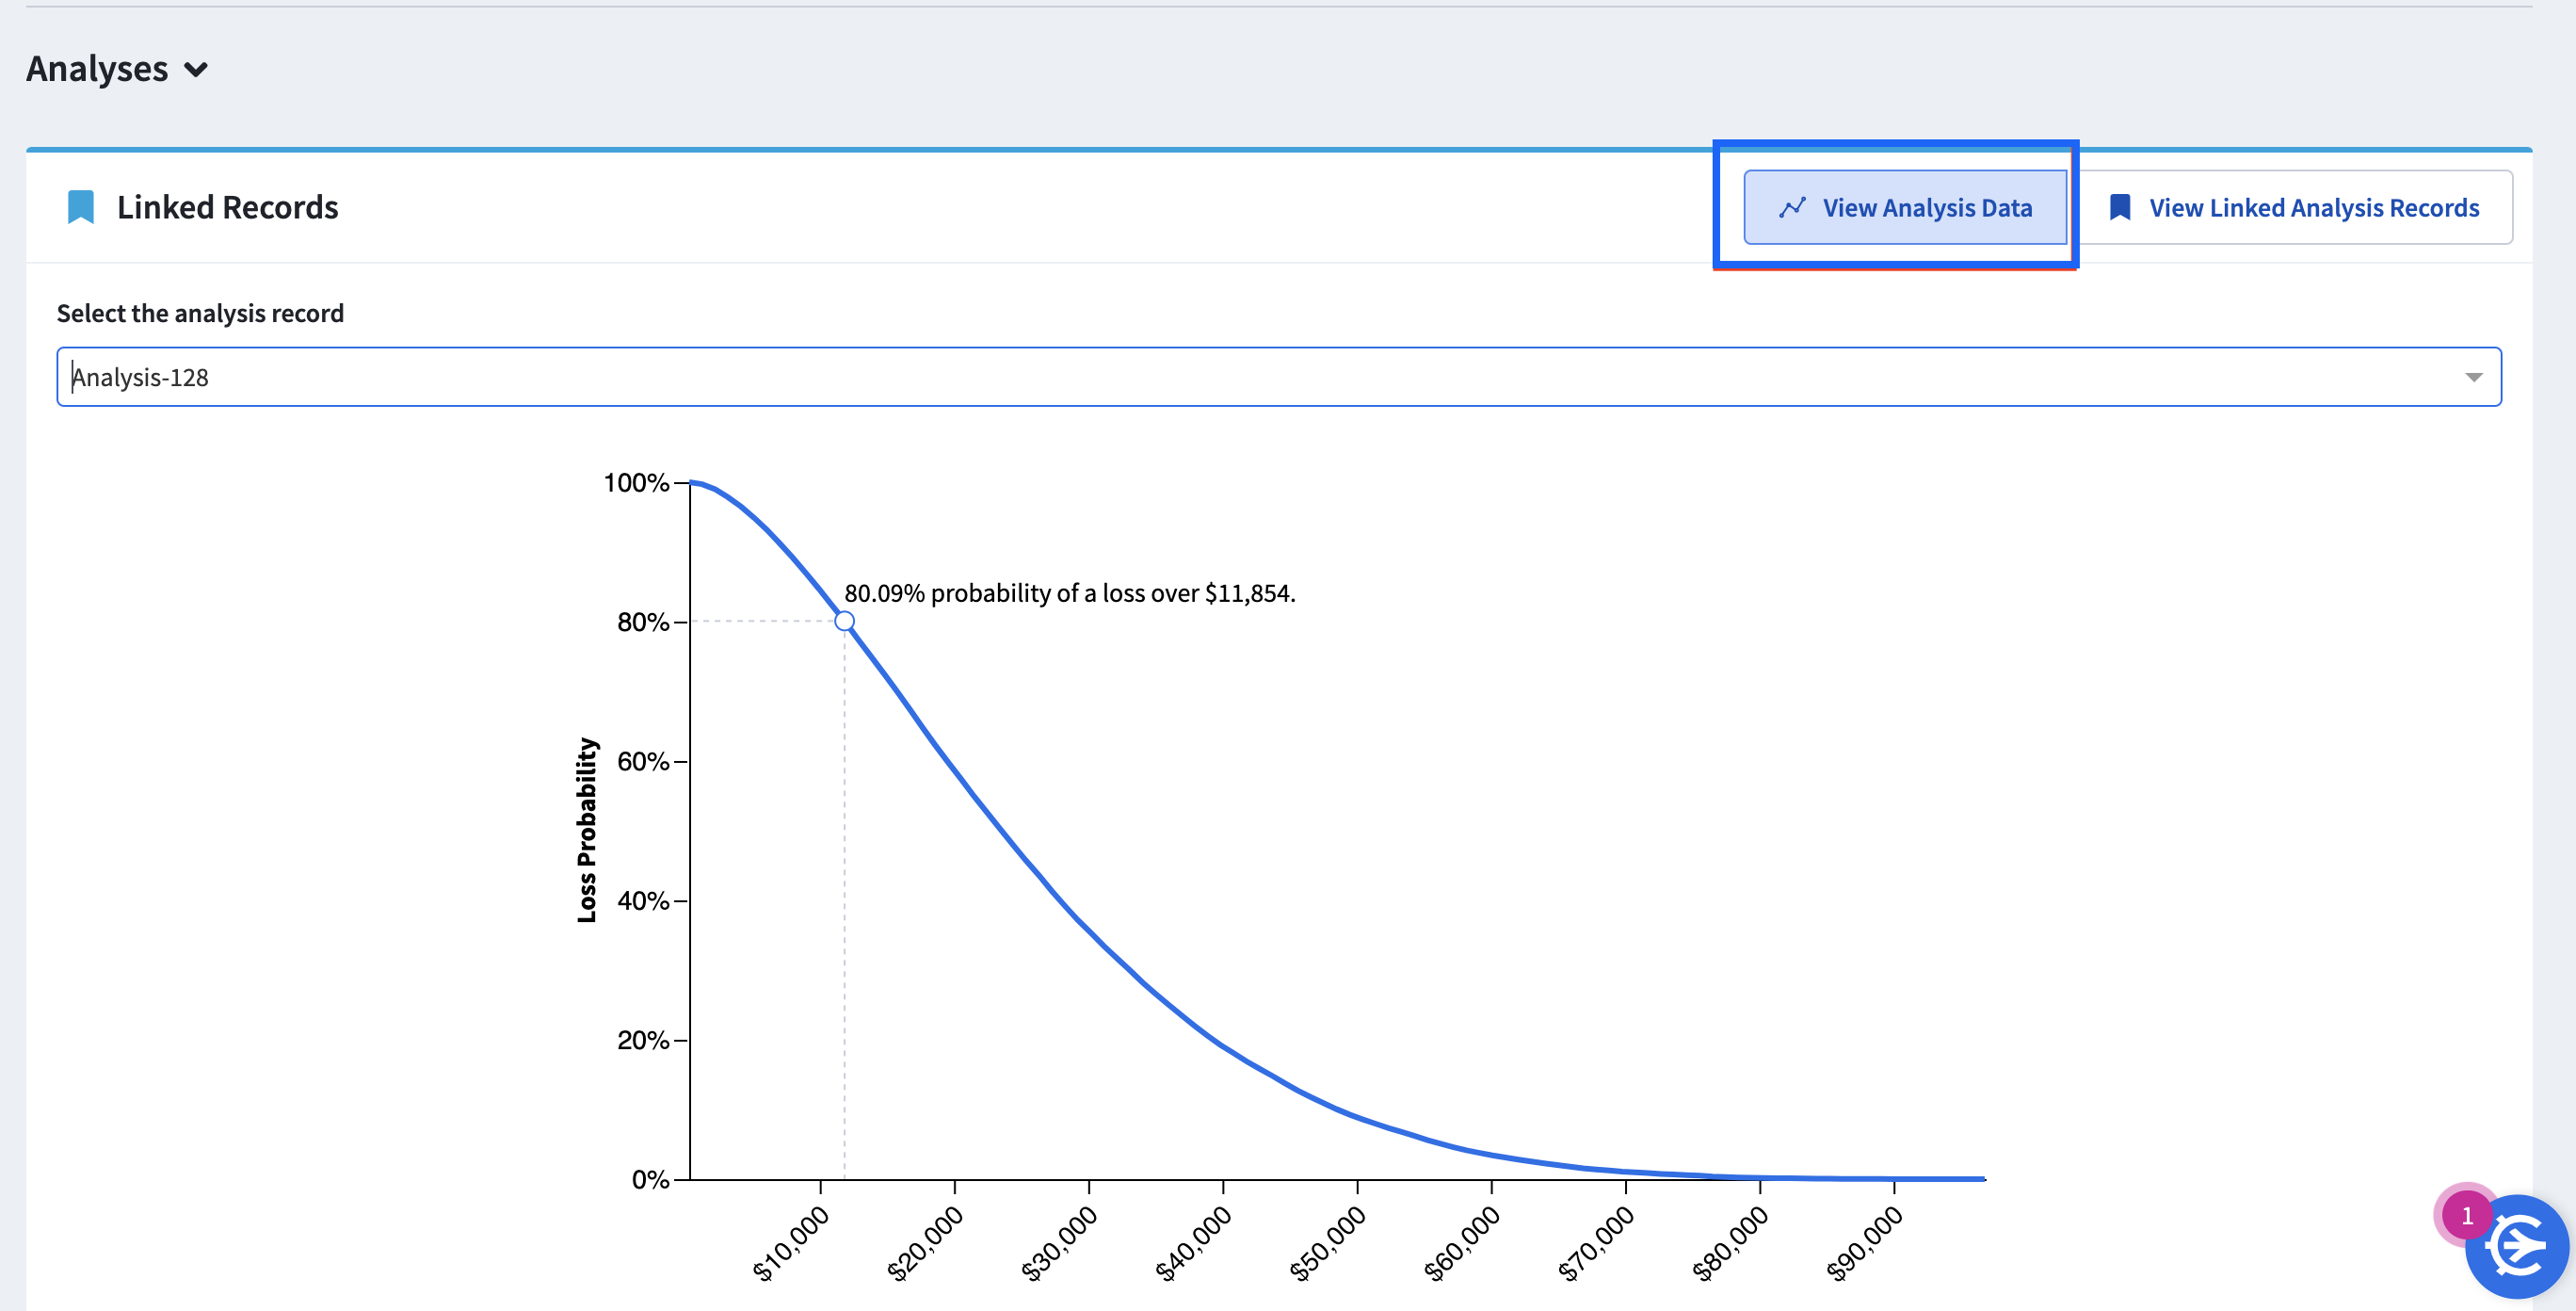
For environments leveraging the Risk Cloud Quantify Module, there is now the ability to see analysis data embedded directly in a Scenario Record.
To see this in action navigate to a Scenario Record and in the Linked Workflow section for Analyses, select "View Analysis Data". From there a dropdown will provide the option for viewing all the Analyses linked to the Scenario.
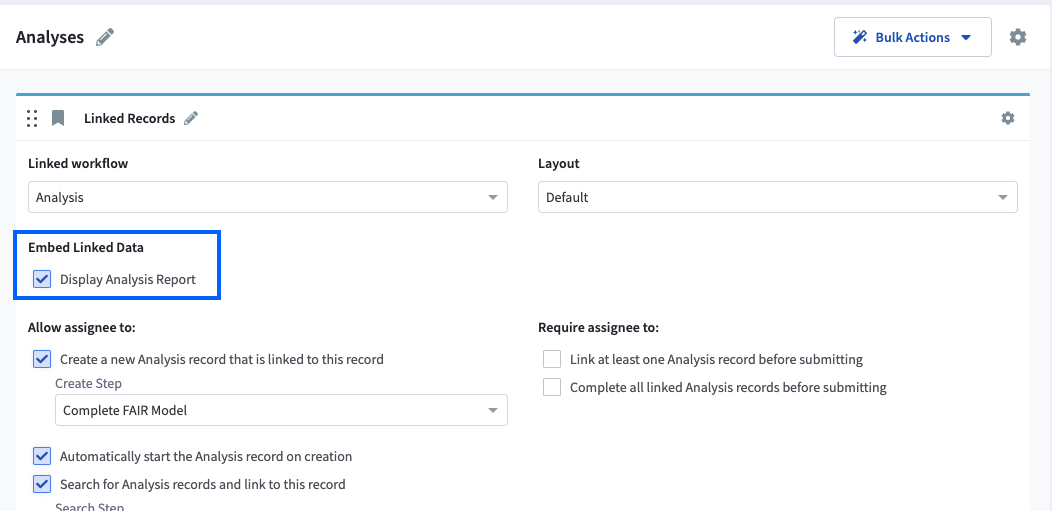
With the v.2022.2.1 release comes the ability to configure if/when the analysis report should appear in the linked workflow section when an analysis workflow is linked.
And More!
- Additional Home Screen Navigation: Authorized builders of a given Application will now have the option to navigate from the Home Screen of that Application directly to the Application Canvas
- Renaming of Deactivated Users: Formerly known as "disabled users", a user will now be considered deactivated with indicators on User Fields and Permission Sets
New in Risk Cloud Exchange (RCX)
Now Available and Recently Updated Content:
- Applications: Internal Audit Management
- Integrations: CUBE
v. 2022.2.1
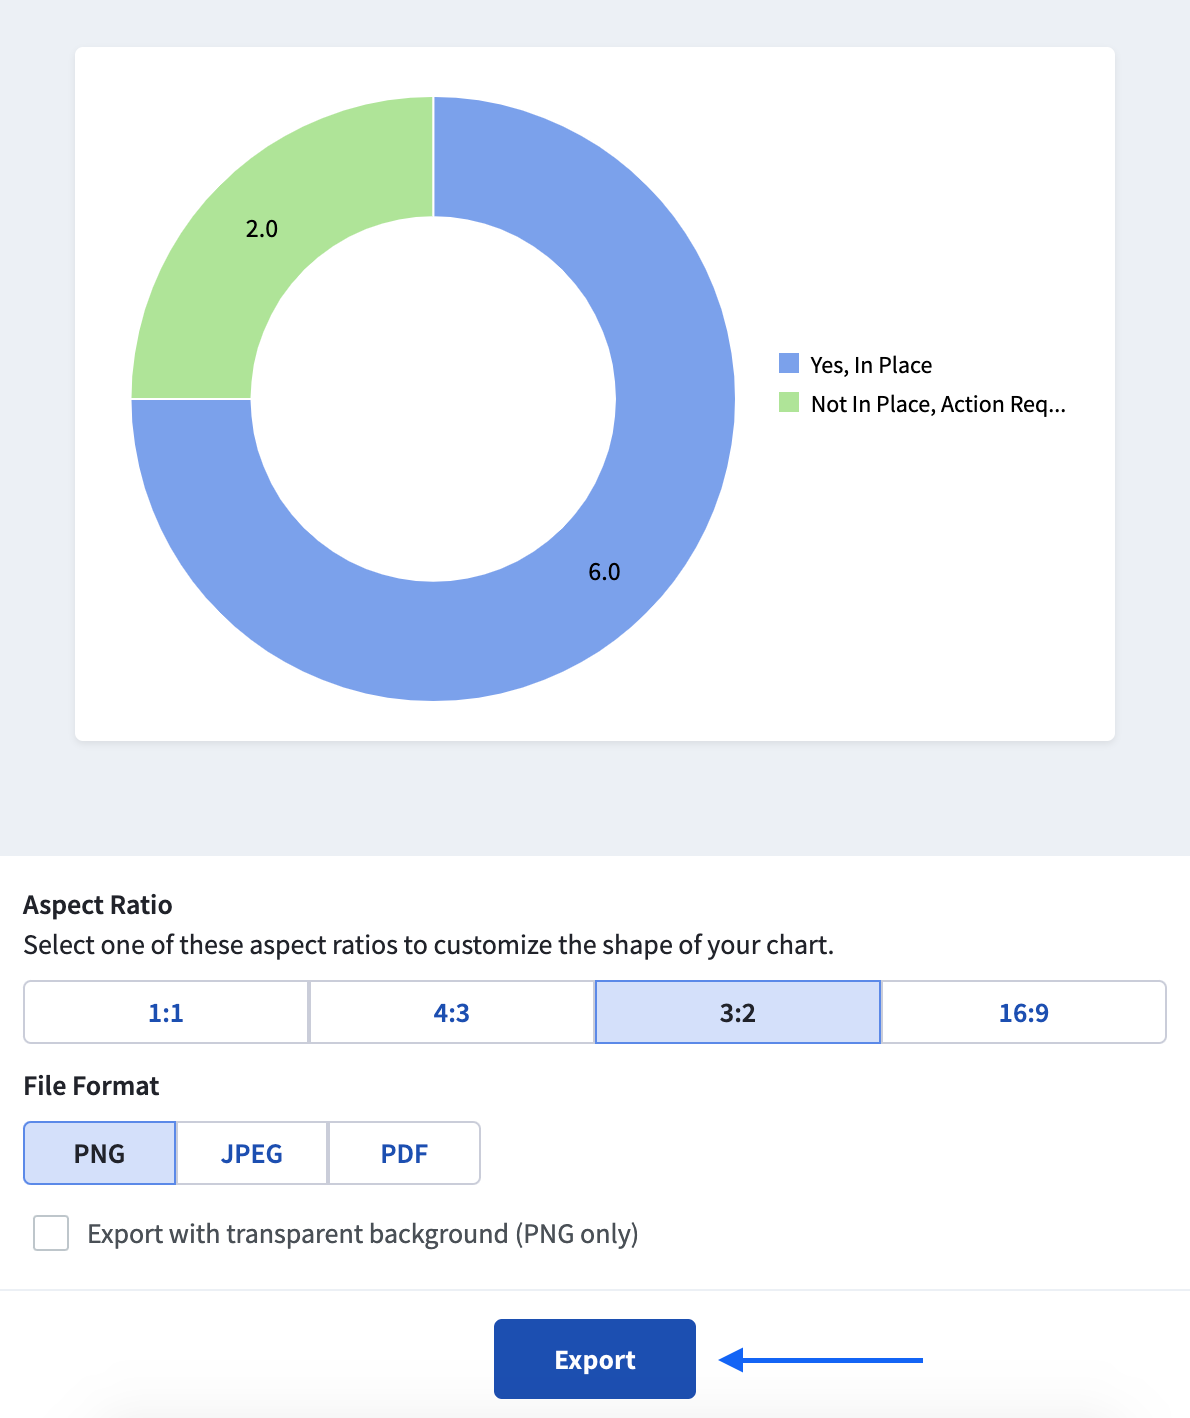
Visual Report Exporting Options
You are now able to export your favorite Visual Reports directly from the Visual Reports screen or a Dashboard as a PNG, JPEG, or PDF! Exporting Visual Reports will allow for easier sharing of visualized metrics with stakeholders across organizations.
And More!
- Quantify Dashboard Formatting: Updates to spacing on Risk Cloud Quantify Dashboards to properly space reports.
- Table Report Sorting: Ability to sort by Quantify Fields in Table reports including minimum, maximum, mean, and median analysis outputs.
- Quantify User Access Restrictions: Ability to run Risk Cloud Quantify Analysis Reports is now restricted to the user who is assigned to the analysis record.
- Quantify Table Reports: Risk Quantification output Fields will only appear for the relevant Analysis Workflow when creating or editing a Table Report.